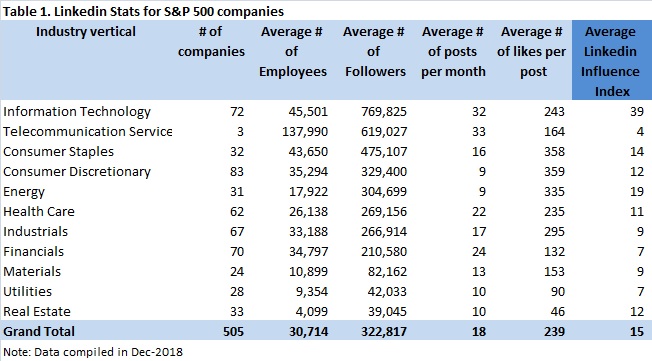
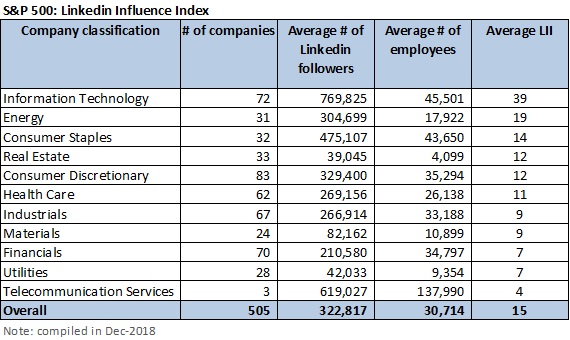
Posted above are key Linkedin stats for the S&P 500, divided into 11 industry verticals. Choose the most comparable vertical for your company, and compare your stats.
So how do you fare in terms of posts, likes, and Linkedin Influence Index scores?
Note: Check out my previous post on Linkedin Influence Index here.
In my previous article on Measures of Linkedin Influence,
the data showed that BCG and McKinsey are head and shoulders above their peers
in terms of number of Linkedin followers, and even when controlled for company
size, these two still come out on top.
There’s another measure of Linkedin influence where BCG and
McKinsey are outliers: number of likes per post. This article explores some
factors that contribute to a post getting liked, and highlights a few simple
practices that you can implement to increase your post likes and overall Linkedin
influence.
There’s another measure of Linkedin influence where BCG and McKinsey are outliers: number of likes per post.
Number of likes per Linkedin post: who are the top performing firms?
A “like” on a Linkedin post is a signal of
reader approval. The number of likes a Linkedin post receives is then
indicative of its value to its readers. So, it follows that companies that
consistently get high numbers of likes to their posts are proficient at
creating valuable content.
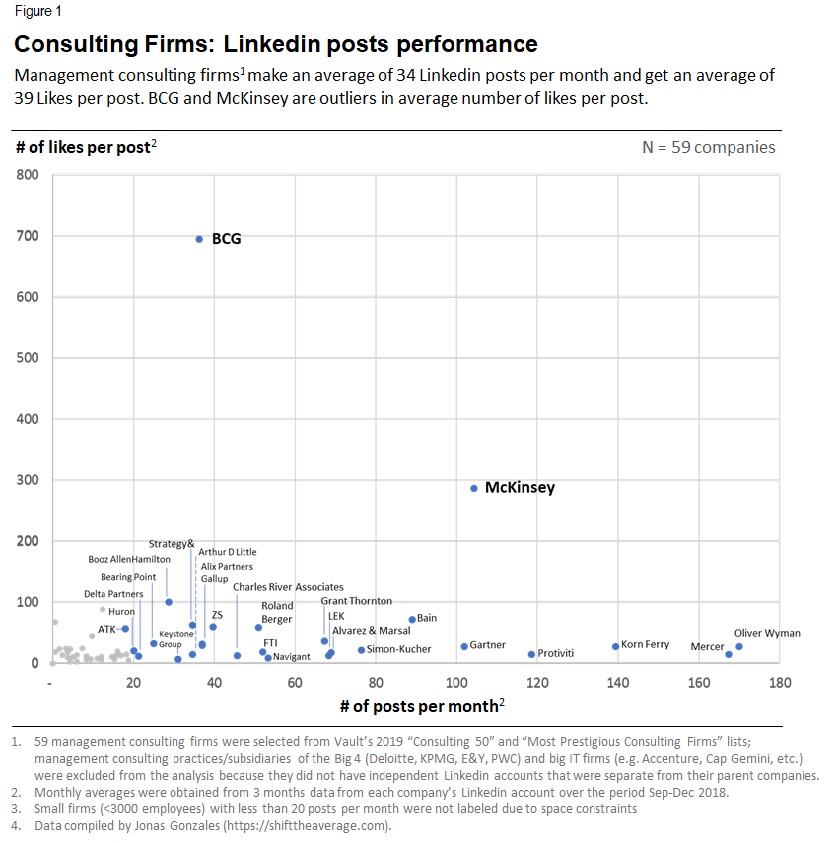
In order to understand how well consulting firms performed
in creating valuable content to their readers, I compiled the average “likes
per post” for 59 consulting firms over the period of Sep-Dec 2018. I then
plotted this against number of posts per month as shown in the scatter plot
below.
A “like” on a Linkedin post is a signal of reader approval. The number of likes a Linkedin post receives is then indicative of its value to its readers.
The data tells us that management consulting firms make an
average of 34 Linkedin posts per month, and receive an average of 39 Likes per
post (within 6 weeks of the posting date).
Figure 1 above shows us that BCG and McKinsey significantly
outperform all other consulting firms in average number of likes per Linkedin
post. Further analysis was conducted by controlling for number of followers (I
calculated the “average likes per post divided by # of followers” for all 59
firms), and results showed BCG and McKinsey still near the top for big firms (>3,000
employees).
The graph also tells us that frequency of posts have little
impact on number of likes per post, which is further validated by a low
correlation coefficient (R=0.10) between these two variables.
Linkedin posts which
get the highest number of likes
I did a qualitative analysis of the Linkedin posts of consulting firms in order to understand what posts get the most likes. I analyzed ~8,700 posts made by 59 consulting firms over the period of Sep-Dec 2018, and found the following:
Linkedin posts of advisory/consulting companies can be classified under three general categories:
Thought Leadership: articles that provide news, information, and insights to readers; mostly based on research and projects that the company has done.
Recruitment: anything that directly or indirectly promotes recruitment for the company; some examples are: feature story on a company office (in a particular city), feature story on an employee, announcements of events/awards/partnerships/policies/etc. that showcase the company’s attractiveness as an employer, job openings, recruitment events, etc.
Miscellaneous: anything that does not fall under the two categories above; most of these posts are announcements such as: company’s participation in international forums, a company partner to be the keynote speaker for a convention, company partnerships with other organizations, new partner joining the firm, promotions, etc.
Posts on Thought Leadership, on average,
received the highest number of likes.
Even within the same Linkedin account, there is
a large variation in number of likes for thought leadership posts.
Factors such as industry vertical and business topic
potentially contribute to this variation.
However, one factor that stands out which
significantly affects number of likes is what I call “accessibility of value”. Simply
put, this refers to the number of clicks that the reader has to make in order
to get to the meat of the content (value). Posts that require fewer clicks
(high accessibility of value) receive more likes. This is why you’ll be able to
observe that Linkedin posts with infographics/charts/tables get the highest
number of likes. For these posts, readers do not need to click on anything else
in order to learn something new and thus receive something of value. This is
one of the reasons why BCG thought leadership posts have the highest number of likes
(even when we control for number of followers).
One factor that stands out which significantly affects number of likes is what I call “accessibility of value”. Simply put, this refers to the number of clicks that the reader has to make in order to get to the meat of the content (value). Posts that require fewer clicks (high accessibility of value) receive more likes.
Miscellaneous posts received the lowest number of likes. In fact, there is a negative correlation between number of miscellaneous posts (as a % of total posts) and: average number of likes per post (R= -0.16), Linkedin influence index (R= -0.28). Although these are correlation coefficient figures, the direction of causality is quite clear. And it simply means that:
The higher the % of miscellaneous posts you make (% of total posts), the average number of likes that your posts receive as a whole also go down; the fact that miscellaneous posts get very few likes of course contributes to this.
The higher the % of miscellaneous posts you make (% of total posts), the less followers you get.
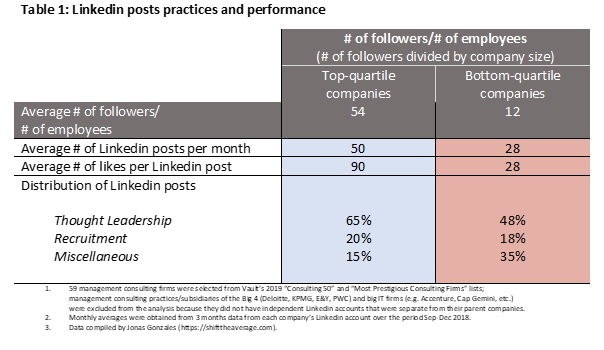
I also did an analysis of top-quartile and bottom-quartile companies based on Linkedin influence index scores (see my previous article on this metric), and found significant differences in their Linkedin posts practices and performance:
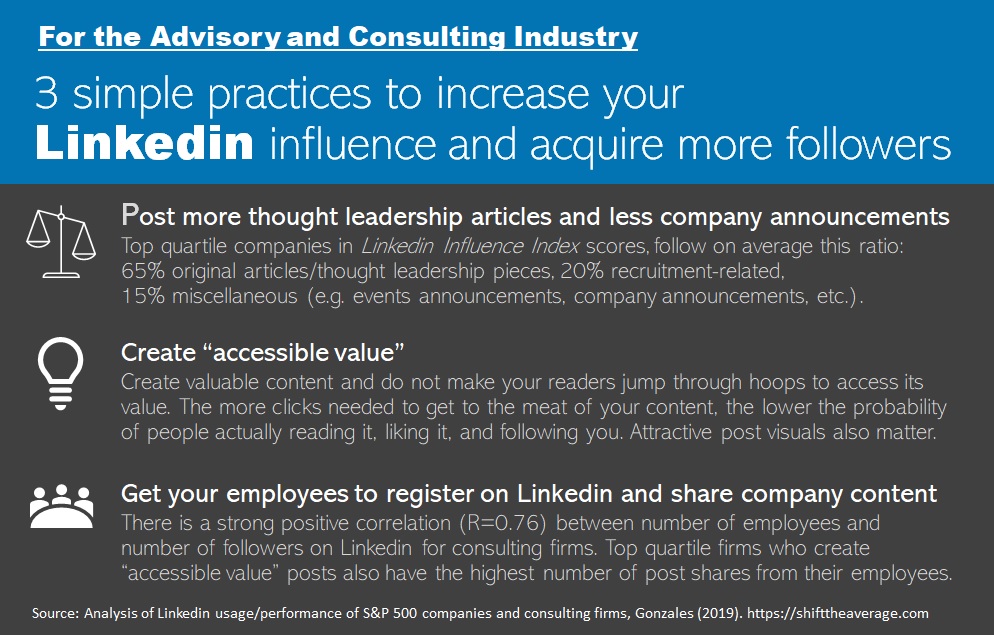
Three simple
practices that can get you more followers and more post likes
The key takeaways from this analysis are:
Post more thought leadership articles and less company announcements
Create relevant and valuable content (thought leadership pieces, etc.) for your target audience. Before posting, ask yourself these questions:
Will this provide my readers with information and updates that might be important for them?
Will this help my readers make better business decisions?
Will this help my readers get better at their work/business?
Company announcements also matter, as they may
help establish or strengthen your firm’s reputation/credibility. But it’s
better to have less of these. Very few people really care if one of your firm partners
is keynote speaker for some event.
Top-quartile performers (based on Linkedin Influence Index scores) follow this ratio in their Linkedin posts:
Thought Leadership 65%
Recruitment 20%
Miscellaneous 15%
Create “accessible value”
Do not make your readers jump through hoops to
access the value you create.
The more clicks needed to get to the meat of
your content, the lower the probability of people reading it, liking it, and
following you.
Attractive post visuals matter. Include a relevant
photo in your post. Better yet, include infographics from which readers can
already obtain value.
Get your employees to register on Linkedin and share company content
Scale and reach matter. The more employees you have that are registered on Linkedin, the more people you have potentially sharing your content (and thus get more followers). The data supports this given the strong positive correlation (R=0.76) between number of employees and number of followers on Linkedin.
This goes hand-in-hand with creating “accessible value” posts, as top quartile firms who create “accessible value” posts also have the highest number of post shares from their employees.
These may seem common sense, but the analysis shows they are not common practice. Implement them and separate your firm from the competition.
2 charts that show how McKinsey and BCG are ahead of their competition, and why this matters to you
It was in 2018 when I restarted using Linkedin and found out that in the half-dozen years since I last used it, it had evolved from just being a professional social network to becoming one of the largest online content publishing platforms. By 2018, Linkedin had over 575 million members, of whom millions were creating, sharing, and reading a staggering volume of content daily. Linkedin had become a massive marketplace where the companies (and individuals) who created the best content acquired the biggest following.
When people follow your account, your posts appear on their Linkedin feeds and they become a captive audience of prospective customers, potential future employees, and ambassadors of your brand. So, the more followers you acquire, the more influence you gain.
But it also works the other way around: those with more influence (e.g. strong brand equity, leading market position, etc.), gain more followers. Number of Linkedin followers thus becomes a measure for influence.
A deeper look at Linkedin influence
In order to get a feel for the Linkedin influence of companies (with # of followers as the primary measure of influence) and understand the factors that contribute to it, I compiled and analyzed1 publicly available Linkedin data for all the companies on the S&P 500. Some key observations are as follows:
S&P 500 companies on average:
Had ~323,000 followers per company account
Had ~31,000 employees per company account
Made 18 Linkedin posts per month with each post receiving an average of 239 likes2
There was a strong positive linear correlation (R=0.71) between number of followers and number of employees
There was a large variation in the number of followers depending on the industry vertical:
IT companies had the highest average at 769,000 and Real Estate companies lowest at 39,000
There was a strong positive linear correlation (R=0.54) between the number of account followers and average number of likes per post
Among the variables I evaluated, the numerical data suggests that the number of followers to your company Linkedin account is influenced by at least two factors:
Company size – the more employees you have on Linkedin, the more followers you’ll get (while the analysis was on correlation between employees and followers, the direction of causality is quite logical in this case)
Industry vertical – even when controlling for company size, some industries have much higher Linkedin usage and more Linkedin followers than others
After a qualitative analysis of hundreds of company Linkedin accounts, I believe that there are two additional factors that contribute to Linkedin influence:
Inherent strength of your company’s brand
How well you are managing your Linkedin account
In order to understand these two factors better, I selected one particular industry where influence plays a strong role in business performance: Consulting.
Linkedin influence analysis for consulting firms
As an ex-consultant, I wondered how consulting firms stacked up against each other and whether the generally-recognized top firms (McKinsey, BCG, Bain) also had the most followers on Linkedin (and ergo, the most influence).
In order to come up with my list of firms to evaluate, I used Vault’s 2019 (www.vault.com) list of top consulting firms as a reference. Given that I primarily wanted to compare pure consulting firms and needed to maintain a like-for-like analysis, I had to exclude the big 4 accounting/audit firms (Deloitte, PWC, E&Y, and KPMG) and the big tech consulting/IT implementation firms (e.g. Accenture, CapGemini, etc.) because most of them did not have separate Linkedin accounts for their consulting practices. I also only used each company’s main Linkedin account; secondary/regional/practice-specific company accounts were not included. All the data were collected over the period of September-December 2018.
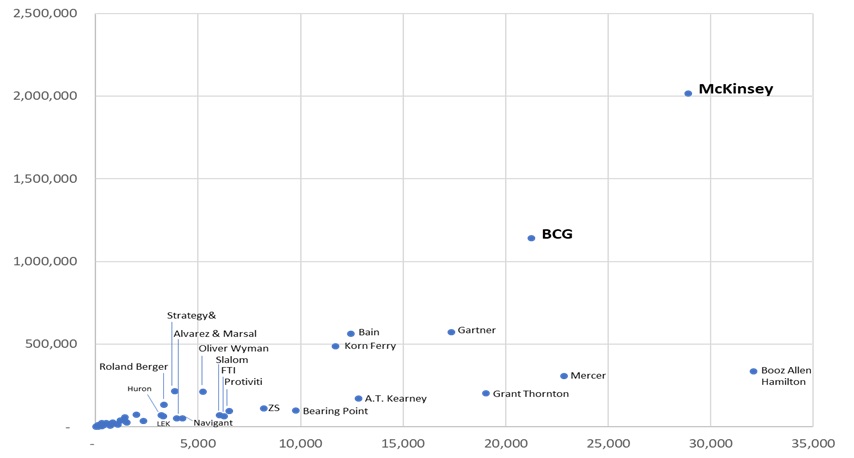
The analysis involved tallying each firm’s number of employees on the x-axis versus its number of Linkedin followers on the y-axis. The figures were plotted on a scatter plot diagram, and shown in Figure 1 below.
One can quickly observe that in terms of number of Linkedin followers, McKinsey and BCG are outliers compared to the rest of the competition.
But given that McKinsey and BCG have significantly more employees than their competitors, they were also expected to have the highest number of followers given the strong positive correlation (R=0.76) between number of employees and number of followers.
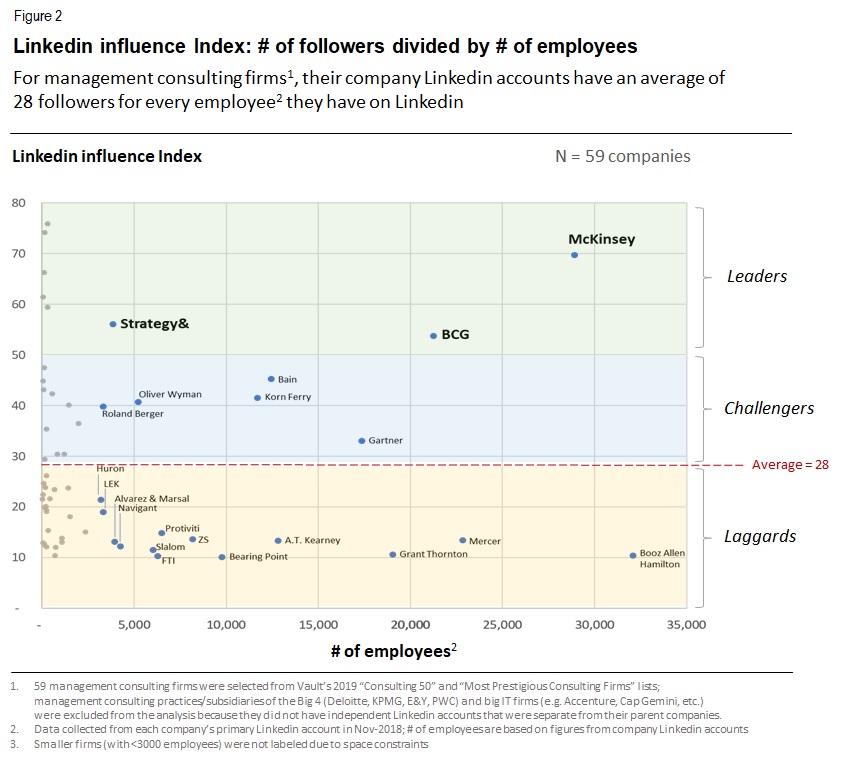
So, if we wanted to compare influence that was independent of company size, the absolute number of followers is then an insufficient measure. A size-adjusted metric for influence can be derived by dividing the number of followers by number of employees. And this is what I did for each of the 59 companies above, and plotted them as shown in Figure 2 below.
With the size-adjusted measure which I’ve labelled “Linkedin Influence Index” (LII), McKinsey and BCG are still leaders for large consulting firms (>3000 employees), but they have now been joined by Strategy& (2nd place) and Bain (4th place).
McKinsey’s LII of 70 means that there are 70 followers for every employee it has on Linkedin. For the 59 firms included in the analysis, the average LII is 28. What this tells us is that McKinsey is significantly above its peers in terms of attracting followers to its Linkedin account. The generally-recognized top three firms (and including Strategy&) are also the top performers in terms of LII scores.
Some key observations I’ve made about LII figures are as follows:
Small firms with less than 3,000 employees have significantly higher LIIs (average LII = 38) than larger firms (average LII = 25)
The data suggests that as firms get bigger, LIIs typically go down, with diminishing “returns” (followers) for each new employee; this same observation was also made with the S&P 500 companies
The significantly higher performance of McKinsey, BCG, and Bain compared to their competition on both measures of Linkedin influence (# of followers, LII) provides some validation that brand strength translates into Linkedin influence.
Using the LII as a comparative measure of Linkedin performance
The LII is an easily-derived metric that gives you the number of Linkedin followers you have per employee on Linkedin. It is a “comparative” metric that only has value when compared to the LIIs of your competitors. It gives you an indication of your Linkedin influence relative to your competition.
The table below provides S&P 500 benchmarks for LII figures.
As this article has stretched much longer than I initially intended, please watch out for its continuation where I’ll be discussing my observations and analysis of how leaders and laggards in consulting managed their Linkedin accounts.
I hope you enjoyed reading this 😊
Footnotes:
Number of followers, employees, posts, and likes, were manually compiled from the company accounts of all the S&P 500 companies over the period Sep-Dec 2018.
The average of 240 Likes per post were over an average span of 6 weeks since the post was published.